| Linear Representations
Linear functions can be represented at least 4 ways: Table, Graphical,
Word Problems and Formula.
Example 2 will be used to illustrate these representations:
Example 2. Word Problem:
The theater attendance of the "Swan in Winter" decreases after the first
performance at a constant rate during its first 7 days of performance;
the 2nd day the attendance was 700 and the 4th day the attendance was 600.
Write a linear formula for theater attendance with respect to time.
Since this is a linear decreasing function, the rate of change (the
slope, m) is going to negative.
The opening night's performance of the play is considered to be day
0 or time, t = 0. Let n be number of attendance and
t
be time in days after opening night.
First find the rate or slope or m:  patrons per day
Then find the y-intercept, b: Do this by including the slope, -50 into
the linear model and using any of the pair of points given, solve for b:
Let's use day 2: (2, 700):
So  ,
so there were 800 patrons at opening day / night. ,
so there were 800 patrons at opening day / night.
The Formula for the Example 2 is
therefore: 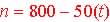
Point-Slope Linear Formula:
for point (2, 700) and slope = -50 then y -
700 = -50(x - 2)
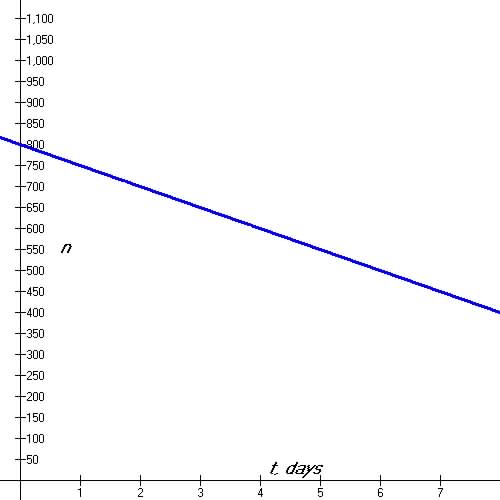
The formula is another representation of the linear model: note the
slope or constant rate is -50 patrons per day and the y-intercept is 800,
n when t = 0.
From the formula we can then construct a Table
and a Graph of the linear model: These
are the two other representation of the linear model. Notice that from
the table that the rate is the same at any interval (this is one test to
see of a paired list of values in a table is linear). Also observe that
the graph of a linear function is a straight line a slope and a y-intercept.
From
Figure 2.1 notice
that the slope is positive, and the y-intercept is zero. From Figure
2.2 notice that the slope is negative and the y-intercept is positive
and from Figure 2.3
notice that the slope is equal to 0.
Table 2.2 Graphical and Tabular Representation of a Linear Model
|