|
General Statistics
|
Examples
Correlation and Regression Problems
|
Correlation and Regression Problems - click on images
to see a larger picture
Programs Used: Correlation
and Regression - Graphs
Review:
r
is correlation coefficient: When r = 0 no relationship exist, when
r is close to  there is a high degree of correlation.
Coefficient of determination is r2, and it is:
(a) The ratio of the explained variation to the total variation: SSR/TSS
(SSR - sum of square for regression and TSS
- total sum of squares)
(b) A r2 of 0.81 means that 81% of the variation is explained
by the regression line or
(c) A r2 of 0.81 means that 81% of the variability in y
is explained by x. |
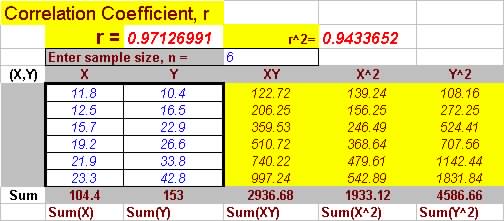
Question 1. From the following table first determine the degree
of linear correlation
(find and interpret the correlation coefficient and coefficient of
determination) and find the line that best fit the data.
| y |
10.4 |
16.5 |
22.9 |
26.6 |
33.8 |
42.8 |
| x |
11.8 |
12.5 |
15.7 |
19.2 |
21.9 |
23.3 |
Solutions:
The correlation coefficient and coefficient of determination are:r
= 0.9713 and r2=0.9434
Since r is close to 1 it means that there is a strong linear
relationship between x and y and from
r2, 94%
of the variation in y can be explained by the variation in x.
From statistics program:
The regression line of best fit line is y=-15.474
+ 2.355 x
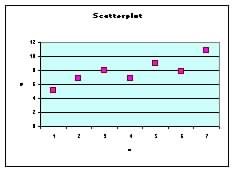
Question 2. Draw a scatter plot of the following data and after
determining its degree of correlation
(find r and r2), find the line of best fit for predicting
the prime lending rate (y) from the inflation rate (x).
| Inflation
rate (ordered data) |
Prime
lending rate |
| 3.3 |
5.2 |
| 5.8 |
6.8 |
| 6.2 |
8 |
| 6.5 |
6.9 |
| 7.6 |
9 |
| 9.1 |
7.9 |
| 11 |
10.8 |
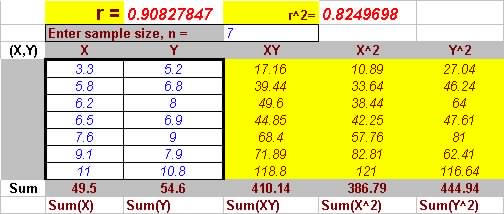
Solutions:
 |
The correlation coefficient , r
= 0.9083
And the coefficient of determination, r2=
0.825
So 82.5% of the variation in prime lending rate can be explained by
the inflation rate.
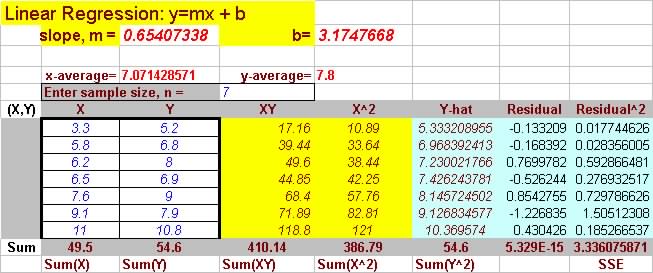
The linear regression line is: y=0.654x
+ 3.175
See program summaries below: |
Correlation program
summary
Regression program
summary
Question 3. (3/11) Education and crime rate ratings for selected
US cities are given below:
Education rating is an index for public/teacher ratio, academic
options in higher education:
the higher the rating the better and other factors and crime
is the crime rate per 100 people
.
City |
Education
(x)
ordered data |
Crime
(y) |
| New York |
30 |
25 |
| Detroit |
31 |
16 |
| Los Angeles |
32 |
20 |
| Boston |
35 |
12 |
| Chicago |
35 |
10 |
| Washington, DC |
36 |
13 |
(a) Draw a scatter diagram. Does there appear to be a linear relationship
between education and crime rate?
(b) Compute and interpret the correlation coefficient and coefficient
of determination
(c) Find and sketch the line of best fit for predicting crime rate from
education rating.
(d) Estimate the crime rate for an education rating of 34.
Solutions:
(a) Scatter
plot
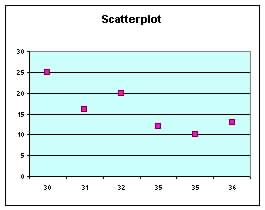
Note plot does not start at x=0 |
(c) Plot of regression line (in
blue)
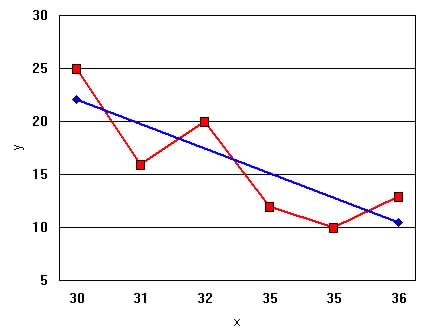
Note plot does not start at x=0
|
Correlation coefficient, r (from
program)
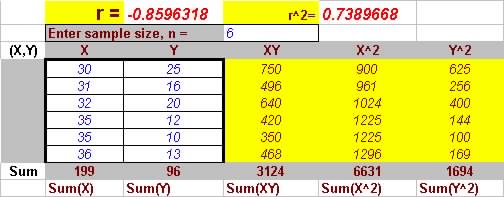
(b) So r = -0.86
suggesting that as x gets large y gets small (evident from the negative
sign) from r2 = 0.739,
73.9%
of the variation in y can be explained by x. |
Linear Regression program
summary
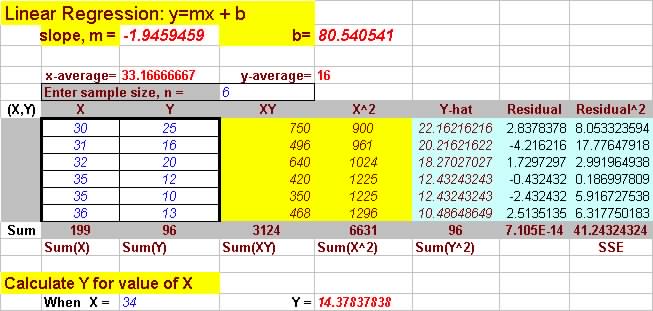
(c) Best fit line is y=-1.95x+80.54
(d) When x = 34, y = 14.38 |
Question 4. The data below summarized the relationship between
number of employees (x)
and number of openings (y) at 11 Boston area hospitals.
 x = 56,562
x2 = 456,525,234
y = 2611
y2 = 818,149
xy = 18,267,023
x = 56,562
x2 = 456,525,234
y = 2611
y2 = 818,149
xy = 18,267,023
(a) Find the correlation coefficient, r
(b) Find the coefficient of determination and interpret its value.
Solution: n = 11
(a) The correlation
coefficient is given by the formula: 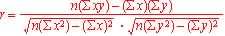
So from data: 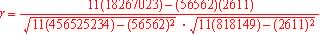
So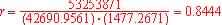
(b) The coefficient
of determination, r2 = 0.8444
= 0.713
This means that 71% of the variations in the number of openings can
be explained by the linear relationship
between it and the number of employees.