|
|
Chi-Square Analysis |
Examples Chi-Square Analysis
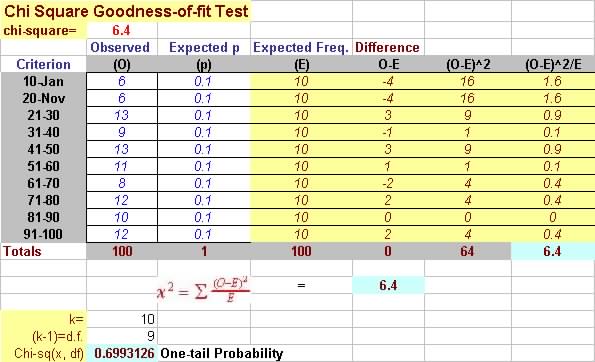
Question 1 (11.13) A computer science major claimed to have written
a program that randomly generates intergers from 1 to 10.
The program generates the following data. Use a 5% level of significance
to test the claim.
| Integers | Frequency |
| 1-10 | 6 |
| 11-20 | 6 |
| 21-30 | 13 |
| 31-40 | 9 |
| 41-50 | 13 |
| 51-60 | 11 |
| 61-70 | 8 |
| 71-80 | 12 |
| 81-90 | 10 |
| 91-100 | 12 |
Solution:
| Chi Square Statistics - From table / Program
Enter alpha 0.05 Enter Degree of Freedom 9 1 - alpha = 0.95 Ch-Square Statistics is 16.9189776 ( 1- alpha) Enter chi-sq test statistics 6.4 P-value is 0.699312575 |
Decision: Do
not reject H0 , since Chi-square Stat < Chi-Square
Table
H0: p=0.10 for each category (equally
likely),
alpha = 0.05 Observed chi-square statistics = 6.40, df = 10-1 = 9, Critical chi-square Table = 16.919 The data do not dispute the claim
|
|
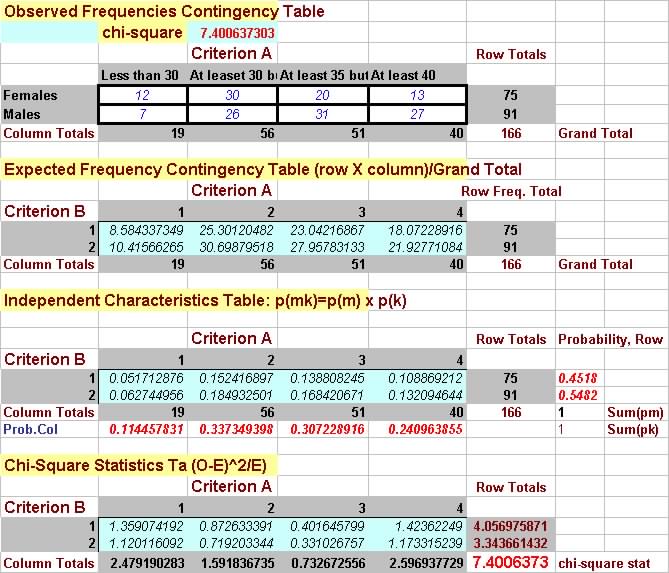
Question 2 (11.19) A group of employees in a large firm claimed
that gender and yearly salary are dependent.
For the following data, test the claim using a 10% level of significance.
| Salary (thousands of dollars) | ||||
| Less than 30 | At leaset 30 but less than 35 | At least 35 but less than 40 | At least 40 | |
| Females | 12 | 30 | 20 | 13 |
| Males | 7 | 26 | 31 | 27 |
Solution:
| Chi Square Statistics
Enter alpha 0.1 Enter Degree of Freedom 3 1 - alpha = 0.9 Ch-Square Statistics is 6.251388746 ( 1- alpha) Enter chi-sq test statistics 7.4 P-value is 0.060184327 |
Decision: Reject
H0 , since Chi-square Stat > Chi-Square Table and P-value
< 0.05
H0: Characteristics of sex and salaries
are independent
alpha = 0.05 Observed chi-square statistics = 7.40, df = (4-1)(2-1)= 3, Critical chi-square Table = 6.251 The data suggest that the charateristics of sex and salary are related. |
 |
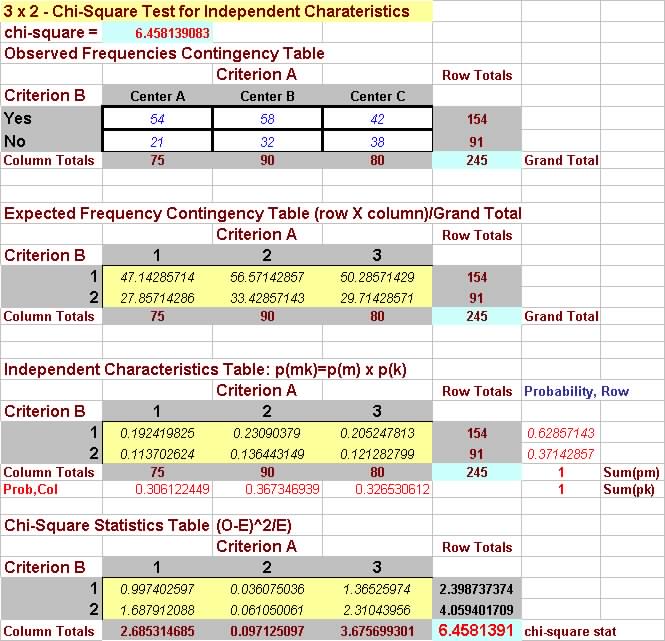
Question 3 (11.26 - 11.22) Former patients from 3 treatment centers
were sampled and asked whether
they were satisfied with the care they received in these centers. The
results are as follows: Use significance level of 5%.
| Are you satisfied with treatment? | ||
| Yes | No | |
| Center A | 54 | 21 |
| Center B | 58 | 32 |
| Center C | 42 | 38 |
| Chi Square Statistics
Enter alpha 0.05 Enter Degree of Freedom 2 1 - alpha = 0.95 Ch-Square Statistics is 5.991464547 ( 1- alpha) Enter chi-sq test statistics 6.4581 P-value is 0.039595096 |
Decision: Reject
H0 , since Chi-square Stat > Chi-Square Table and P-value
< 0.05
H0: Treatment Centers are homegenious with
respect to patient statisfaction
alpha = 0.05 Observed chi-square statistics = 6.4581, df = (3-1)(2-1)= 2, Critical chi-square Table = 5.9915 The data suggest that the treatment centers are not the same with respect
to patient statisfaction.
|
 |