|
|
Inference about 2 sample means and proportions. |
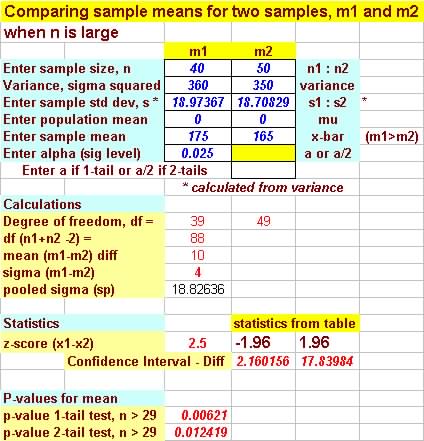
Question 1 (8.13) For the following data, complete the test at the 5% level of significance. Assume that the samples are independent.
(a) It was claimed that the mean of population A was not the
same as the mean of population B.
| n | s2 | ||
| A | 40 | 175 | 360 |
| B | 50 | 165 | 350 |
Solution:
| Given:
Observed value
|
Decision: RejectH0,
since 2.5 > 1.96
and P-value = 2P( = 2(0.0062)= 0.0124 P-value < 0.05 |
This is the results from the test - statistics Program:
 |
(b) It was claimed that the mean of population A was larger than
the mean of population B.
| n | s2 | ||
| A | 35 | 400 | 210 |
| B | 35 | 395 | 105 |
Solution:
| Given:
Observed value
|
Decision: Do
not Reject H0, since 1.33 < 1.65
and P-value = P( P-value > 0.05 |
(c) It was claimed that the mean of population A was less than
the mean of population B.
| n | s2 | ||
| A | 52 | 42 | 260 |
| B | 54 | 48 | 216 |
Solution:
| Given:
(lower tail ) Observed value
|
Decision: RejectH0,
since -2 < -1.65
and P-value = P( P-value < 0.05 |
Question 2. (8.15) Summary information on the height of 57 alto
and 66 soprano singers, all women, in the New York
Choral Society is given (8.15 of text). The vocal part is lower in
pitch than soprano voice part.
| n | s2 | ||
| Alto (A) | 57 | 65.39 | 7.02 |
| Soprano (B) | 66 | 64.12 | 4.75 |
Use a 5% level of significance to determine whether there is a difference in the population mean heights between alto and soprano singers.
(a) Use the classical approach (b) use the P-value approach.
Solution:
| Given:
(2-tail test ) Observed value
|
(a) Decision: RejectH0,
since 2.875 > 1.96
(b) P-value = 2P( P-value < 0.05 |
Question 3 (8.21)
(a) Do the following data support the belief that the mean of
population A is different from the mean of population B?
Assume approximately normality for the populations, and compete the
test using the 5% level of significance.
It was claimed that the mean of population A was not the same as the
mean of population B.
| Sample | n | s2 | |
| A | 8 | 83 | 21 |
| B | 12 | 80 | 5 |
Solution: (Since sample size small use
t-test )
| Given:
(2-tail test ) Observed value
|
(a) Decision: AcceptH0,
since 1.72 < 2.365
(b) P-value = 2P( P-value > 0.05 The data does not suggest the means are different. |
(b) It was claimed that the mean of population A was larger than
the mean of population B. Test at the 1% significance level.
| n | s2 | ||
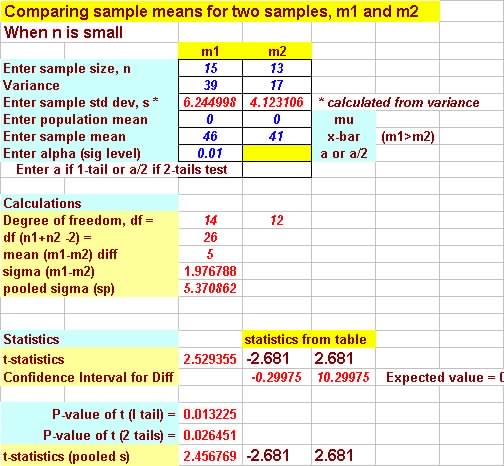
| A | 15 | 46 | 39 |
| B | 13 | 41 | 17 |
Solution: (Since sample size small use
t-test )
| Given:
(1-tail test ) Observed value
|
(a) Decision: AcceptH0,
since 2.53 < 2.681
(b) P-value = P( P-value > 0.01 The data does not suggest the means are different. |
Results from Test Statistics Program:
 |
(c) It was claimed that the mean of population A was less than
the mean of population B. Test at the 10% significance level.
| n | s2 | ||
| A | 10 | 180 | 70 |
| B | 7 | 200 | 340 |
Solution: (Since sample size small use t-test )
| Given:
(1-tail test ) Observed value
|
(a) Decision: Reject
H0,
since -2.68 < -1.440
(b) P-value = P( P-value < 0.01 The data does suggest the mean A is less than mean B. |
Question 4 (8.37)
In each of the following parts, assume independent samples. Note that n refers to sample size and x is the number of successes.
(a) It is claimed that proportion p1
and p2 for population A and B, respectively,
are the same.
Consider the following information and test using the 5% level
of significance.
It was claimed that the population proportion A was not the same as
the population proportion B.
| n | x | |
| A | 250 | 175 |
| B | 175 | 135 |
Solution: (Since proportion being compared
and sample size large use z-score )
| Given:
(2-tail test ) Observed value
|
(a) Decision: AcceptH0,
since 1.63 < 1.96
(b) P-value = 2P( P-value > 0.05 The data does not suggest the proportions are different. |
(b) It is claimed that proportion p1
for population A is larger than proportion p2
for population B,
Consider the following information and test using the 10% level
of significance.
It was claimed that the population proportion A is larger than the population
proportion B.
| n | x | |
| A | 375 | 195 |
| B | 325 | 150 |
Solution: (Since proportion being compared
and sample size large use z-score )
| Given:
(1-tail test ) Observed value
|
(a) Decision: RejectH0,
since 1.63 < 1.96
(b) P-value = P( P-value < 0.10 The data does suggest that proportions A is larger than proportion B. |
(b) It is claimed that proportion p1
for population A is less than proportion p2
for population B,
Consider the following information and test using the 5% level
of significance.
It was claimed that the population proportion A is less than the population
proportion B.
| n | x | |
| A | 425 | 175 |
| B | 400 | 205 |
Solution: (Since proportion being compared
and sample size large use z-score )
| Given:
(1-tail test ) Observed value
|
(a) Decision: RejectH0,
since 1.63 < 1.96
(b) P-value = P( P-value < 0.10 The data does suggest that proportions A is small than proportion B. |
Below is the results from the Test - Statistics Program:
 |
Question 5. (8.41) In a case of Jackson v. Nassau County Civil
Service Commission, 424 F. Supp.
1162, 1167 (E.D.N.Y. 1976), the following information was given concerning
the results of an examination taken by job applicants:
| n | x | |
| Blacks | 40 | 15 |
| Whites | 99 | 14 |
(a) Test the claim that the population proportion of blacks who pass is less than that of whites at the 2.5% level of significance.
(b) The "80% rule" says that a "substantial" disparity between
groups can ordinarily be shown only when the data are significant i.e.,
lead to rejection of the null hypothesis) and the pass rate for the
protected group (blacks in this case) is less than 80% of the pass rate
of the group with the highest pass rate. Do the data meet the requirement
of the 80% rule?
Solution:
(a) Observed z = -2.40 and z-Table = -1.96 ( 1-tail
test ) so Reject H0
since z-statistics = -2.40 < -1.96
or P-value = 0.0083 < alpha
value of 0.025
(b) p-hat = 0.827 which is > 0.80, so data do not meet the requirement of the 80% rule.
From Program:
 |