|
|
Analysis of Variance |
Examples with Solutions - ANOVA
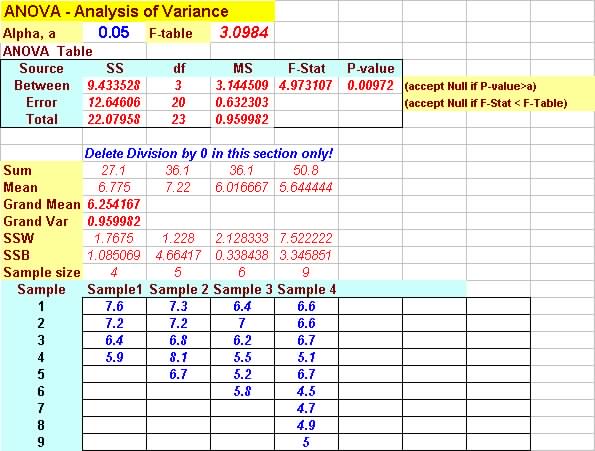
Question 1 The data in the following
table represents the starting weekly wages (in hundreds of dollars)
for skilled workers in selected companies in the specified regions.
Do the data indicate a difference in population means? Use a 5% level
of significance.
| Pacific | East North-Central | West North-Central | South Atlantic |
| 7.6 | 7.3 | 6.4 | 6.6 |
| 7.2 | 7.2 | 7 | 6.6 |
| 6.4 | 6.8 | 6.2 | 6.7 |
| 5.9 | 8.1 | 5.5 | 5.1 |
| 6.7 | 5.2 | 6.7 | |
| 5.8 | 4.5 | ||
| 4.7 | |||
| 4.9 | |||
| 5 |
Solution from programs:
Since F-statistics (4.9731) > F-Table (3.0984) Reject
the Null Hypothesis that the means are the same.
Also since P-value < 0.01 <0.05 (alpha) RejectH0
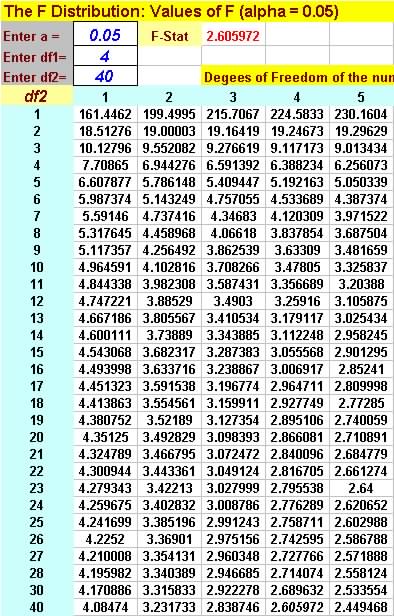
Question 2 (10.31) (a) Complete
the following ANOVA table for ![]() .
.
ANOVA Table (only values in Blue were
given)
| Source | Sum of Squares
(SS) |
Degree of
Freedom
(df) |
Mean Square
|
F-Statistics | P-value /
F-Table |
| Between Samples
(Explained) |
132 | 4 | 33 | 3.3 | |
| Within
Samples (Unexplained) |
400 | 40 | 10 | ||
| Total | 532 | 44 |
(b) Could you reject the null hypothesis at the 5% significance
level?
Since F-statistics (3.3) > F-table (2.6059) Reject
the Null Hypothesis that the means are the same.
Question 3 (10.35) A college administrator
claimed that there was no difference in (population) mean college grade
point averages
for students coming from three high-school A, B, and C. Use the following
data to test the administrator's claim with a 5% significance level.
| A | B | C |
| 1.9 | 2.3 | 2.8 |
| 2.3 | 2.7 | 2.8 |
| 2.8 | 3.2 | 2.9 |
| 2.4 | 2.8 | 3.5 |
| 2.5 | 2.9 | 3 |
| 2.5 | 2.9 |
Since F-statistics (5.9942) > F-Table (3.7389) Reject
the Null Hypothesis that the means are the same.
Also since P-value < 0.013 <0.05 (alpha) RejectH0
