Statistics involving two populations proportions
often have sample sizes that are large (![]() ),
therefore the normal approximation distribution and associated statistics
can be used to determine if or to test whether sample 1 proportion =
sample 2 proportion.
),
therefore the normal approximation distribution and associated statistics
can be used to determine if or to test whether sample 1 proportion =
sample 2 proportion.
That is, when the sample size is greater than
or equal to 30 we can use the
z-score statistics to compare the sample 1 proportion against
sample 2 proportion using estimate of the sample proportion standard deviation, ![]()
The sample distribution of p (proportion) is approximately
normal with a mean or expected value, E(P) = ![]() and standard error
and standard error ![]() .
.
1. Know the statistics used to test two population
proportions ![]() for large sample size.
for large sample size.
For a two population proportions comparison the test statistics is related
to the standard normal distribution:
| Estimates of
sample proportions, p1 and
p2 are:
The pooled data proportion is:
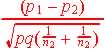
Estimate of combined proportion standard deviation is:
The test statistics is:
The difference of both proportion mean is:
Standard deviation: Confidence Interval for
|
 ,
where
,
where Decision rules:
Upper-Tailed Test (![]() ):
):
Accept H0 if ![]()
Reject H0 if ![]()
Lower-Tailed Test (![]() ):
):
Accept H0 if ![]()
Reject H0 if ![]()
Two-Tailed Test (![]() ):
):
Accept H0 if ![]()
Reject H0 if ![]()
| Population or Sample Identification | Sample size | Number of Successes | Population
proportion
|
| 1 | n1 | ||
| 2 | n2 |
2. Know how to use appropriate statistics to test if two samples proportions are equal or if their difference = 0 (usually large sample size).
3 Types of tests in comparing two sample means:
When comparing the sample proportions, ![]() there are 3 questions to considered:
there are 3 questions to considered:
Question 1:
: Is ![]() ? Ha (Two-tailed test)
? Ha (Two-tailed test)
Question 2:
: Is ![]() ? Ha (Right-tailed test)
? Ha (Right-tailed test)
Question 3:
: Is ![]() ? Ha (Left-tailed test)
? Ha (Left-tailed test)
Question 1:
: Is ![]() ? Ha (Two-tailed test)
? Ha (Two-tailed test)
| Is Are the sample proportions of both samples the same or not the same? If there are the same then the difference between the two proportions will be close to 0. Here we use a two-tailed test by computing the confidence
interval for the test at the level of significance If the test statistics for z falls outside this interval we decide that the means differs, we chose the alternate hypothesis, Ha Otherwise we have no reason to think that they differ, H0 |
 |
By Examples:
Problem 1. Test at the 95% confidence level if there is a difference
between these two samples:
| Sample
ID |
Sample size | Number
of
Successes |
Population
proportion
|
| 1 | 150 | 18 | 0.12 |
| 2 | 180 | 20 | 0.11 |
Given difference ![]() ,
n > 30 (large so can use normal approximation of z-score)
,
n > 30 (large so can use normal approximation of z-score)
Step 1 - Hypothesis: The claim that![]() , the null hypothesis.
, the null hypothesis.
The alternate hypothesis is that ![]()
H0 :![]()
Ha :![]()
Step 2. Select level of significance:
This is given as ![]() (5%)
(5%)
So for two-tailed test: ![]()
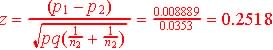
Step 3. Test statistics and observed value.
&
|
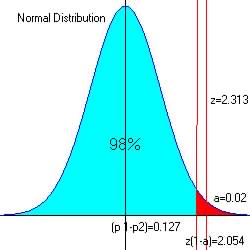
The test statistics
is:
|
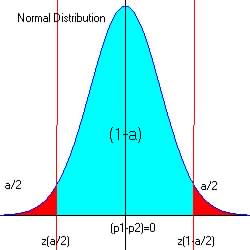
Step 4. Determine the critical region (favors Ha)
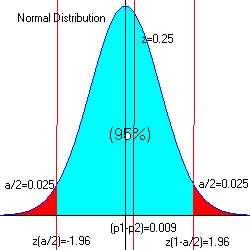
For alpha = 0.05 at both ends of intervals: 0.025 and 0.975, za/2
= -1.96 and z1-a/2 = 1.96 (from reference
table)
 |
The critical region is ![]() and
and ![]()
Step 5. Make decision.
No not reject the null hypothesis if ![]() or
or ![]()
The observed z = 0.25, and since 0.25 < 1.96 and is not in the critical region, we have no reason to reject H0 in favor of Ha.
There the difference between both proportions are 0.
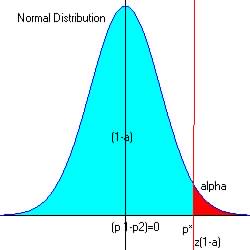
Question 2:
: Is ![]() ? Ha (Right-tailed test)
? Ha (Right-tailed test)
| Is Is the proportion of one sample greater than the proportion of another sample? If one is smaller than the other, then their difference will be greater than or less than 0. Here we use a one-tailed test by computing the confidence
interval for the test at the level of significance If the test statistics for z falls outside this interval we decide that the means differs, we chose the alternate hypothesis, Ha Otherwise we have no reason to think that they differ, H0 |
 |
By Examples:
Problem 1. Test at the 0.02 significance level whether sample
proportion 1 is greater than sample proportion 2:
| Sample
ID |
Sample size | Number
of
Successes |
Population
proportion
|
| 1 | 40 | 13 | 0.26 |
| 2 | 300 | 40 | 0.1333 |
Given difference ![]() ,
n > 30 (large so can use normal approximation of z-score)
,
n > 30 (large so can use normal approximation of z-score)
Step 1 - Hypothesis: The claim that ![]() , the null hypothesis.
, the null hypothesis.
The alternate hypothesis is that ![]()
H0 :![]()
Ha :![]()
Step 2. Select level of significance:
This is given as ![]() (2%)
(2%)
Step 3. Test statistics and observed value.
&
|
The test statistics
is:
|
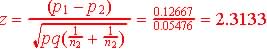
Step 4. Determine the critical region (favors Ha)
For alpha = 0.02, z1-a/2 = 2.054
(from
reference
table)
 |
The critical region is ![]()
Step 5. Make decision.
No not reject the null hypothesis if ![]()
The observed z = 2.313, and since 2.313 > 2.054 and is in the critical region, we reject H0 in favor of Ha.
There the difference Sample 1 is greater than sample 2's proportion.
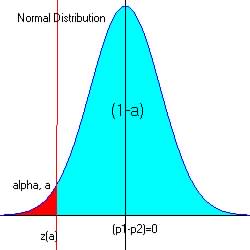
Question 3:
: Is ![]() ? Ha (Left-tailed test)
? Ha (Left-tailed test)
| Is Is the proportion of one sample less than the proportion of another sample? If this is true then their difference will not be equal to 0. Here we use a one-tailed test by computing the confidence
interval for the test at the level of significance If the test statistics for z falls outside this interval we decide that the means differs, we chose the alternate hypothesis, Ha Otherwise we have no reason to think that they differ, H0 |
 |
By Examples:
Problem 1. Test at the 0.10 significance level whether sample
proportion 1 is greater than sample proportion 2:
| Sample
ID |
Sample size | Number
of
Successes |
Population
proportion
|
| 1 | 300 | 40 | 0.1667 |
| 2 | 50 | 12 | 0.24 |
Given difference ![]() ,
n > 30 (large so can use normal approximation of z-score)
,
n > 30 (large so can use normal approximation of z-score)
Step 1 - Hypothesis: The claim that ![]() , the null hypothesis.
, the null hypothesis.
The alternate hypothesis is that ![]()
H0 :![]()
Ha :![]()
Step 2. Select level of significance:
This is given as ![]() (10%)
(10%)
Step 3. Test statistics and observed value.
&
|
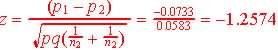
The test statistics
is:
|
Step 4. Determine the critical region (favors Ha)
For alpha = 0.10, za/2 = 1.282 (from
reference
table)
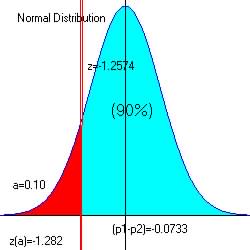 |
The critical region is ![]()
Step 5. Make decision.
No not reject the null hypothesis if ![]()
The observed z = -1.257, and since -1.257 > 1.282 and is not in the critical region, we have no reason to reject H0 in favor of Ha.
There the difference between both proportions are close to 0 or proportion
for sample 1 = proportion for sample 3, the null hypothesis.