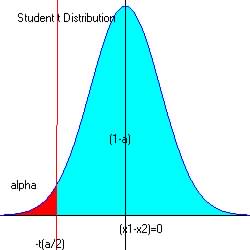
Comparing two population means - small independent samples
If the sample size is small (![]() )
and the sample distribution is normal or approximately normal, then the
Student's
t distribution and associated statistics can be used to determine
if or test whether the sample mean = population mean.
)
and the sample distribution is normal or approximately normal, then the
Student's
t distribution and associated statistics can be used to determine
if or test whether the sample mean = population mean.
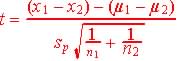
Comparing sample means of two independent samples with small sample size is similar to comparing a sample mean against a population mean (Chapter 7); the t-statistics or student's t distribution is used to evaluate tests. The only difference is the values for the parameters used in determining the statistics.
The hypothesis testing involving two different
means study the distribution of their differences:.![]()
1. Know the basic general statistics used for
comparing two population means - small sample size or ![]() is
unknown.
is
unknown.
If we have two populations or sample distributions the following basic
statistics can be obtained from each:
| Population or Sample Identification | Sample size | Sample mean | Population mean | Sample Standard deviation |
| 1 | n1 | |||
| 2 | n2 |
Small sample size studies use the student t statistics and large sample sizes studies use the standard normal z-score statistics.
If we let ![]() (
(![]() and
and ![]() and
and ![]() be a combined standard deviation for both sample distribution or data sets,
then
be a combined standard deviation for both sample distribution or data sets,
then
| For large sample
size (
|
For small sample
size (
|
 , the z-score
 , the student's t, df = n-1
For small sample size the standard deviation and test statistics
are:
| Standard Deviation:
Pooled sample standard deviation when
Also |
Test statistics,
t, df = n-1 (smallest sample size)
Pooled Test statistics, t ,
Confidence Interval is |


2. Know how to use appropriate statistics to test if two sample means are equal or if their difference = 0 (small sample size).
3 Types of tests in comparing two sample means:
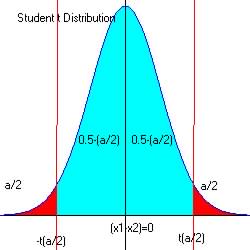
When comparing the sample means, ![]() there are 3 questions to consider:
there are 3 questions to consider:
Question 1:
: Is ![]() ? Ha (Two-tailed test)
? Ha (Two-tailed test)
Question 2:
: Is ![]() ? Ha (Right-tailed test)
? Ha (Right-tailed test)
Question 3:
: Is ![]() ?
Ha
(Left-tailed test)
?
Ha
(Left-tailed test)
Example 4 is an example of the pool t-test.
Question 1:
Is ![]() ? Ha (Two-tailed test)
? Ha (Two-tailed test)
| Is Is the two sample means or the same or not the same? If the two means are the same then their difference is approximately = 0. Here we use a two-tailed test by computing the confidence
interval for the test at the level of significance If the test statistics for z falls outside this interval we decide that the means differs, we chose the alternate hypothesis, Ha Otherwise we have no reason to think that they differ, H0 |
 |
By Examples:
Problem 1. Two types of cars are compared for acceleration rate.
The test runs are recorded for each car and the results for the mean elapsed
time recorded below:
| Sample mean | Sample standard deviation | Sample size | |
| Car A (x1) | 8.5 | 1.8 | 20 |
| Car B (x2) | 7.2 | 2.1 | 30 |
Construct a 98% CI for the difference in the mean elapsed time for the two types of cars. Using this CI, determine if there is a difference in the mean elapsed times?
Given difference ![]() ,
at least one of the same < 30 (small so must use the student's t distribution
or t-statistics),
,
at least one of the same < 30 (small so must use the student's t distribution
or t-statistics),
Step 1 - Hypothesis: The claim that ![]() , the null hypothesis.
, the null hypothesis.
The alternate hypothesis is that ![]()
H0 :![]()
Ha :![]()
Step 2. Select level of significance:
This is given as ![]() (2% = 100 - 98)
(2% = 100 - 98)
So for two-tailed test: ![]()
Step 3. Test statistics and observed value.
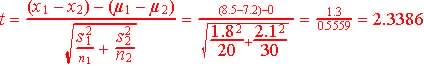
Step 4. Determine the critical region (favors Ha)
For alpha = 0.02 at both ends of intervals: 0.01 and 0.99, ta
= 2.5395 and -ta = -2.5395
(from reference
table)
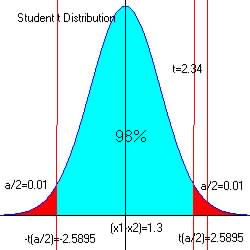 |
The critical region is ![]() and
and ![]() with df = 19; smallest of (20-1) and (30-1)
with df = 19; smallest of (20-1) and (30-1)
A 98% Confidence Interval for the difference is ![]() or (diff: -0.1117 to 2.7117) shown
in graph above
or (diff: -0.1117 to 2.7117) shown
in graph above
Step 5. Make decision.
No not reject the null hypothesis if ![]() or
or ![]()
The observed t=2.3386, and since 2.3386 < 2.5395 and is not in the critical region, we have no reason to reject H0 in favor of Ha.
Note also that a difference of 1.3 is between the confidence intervals of -0.1117 and 2.7117 the blue region for the null hypothesis acceptance.
Therefore the difference between both means are significantly different from 0.
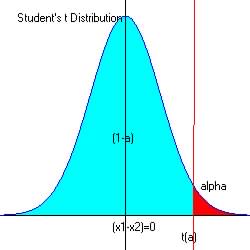
Question 2:
: Is ![]() ? Ha (Right-tailed test)
? Ha (Right-tailed test)
| Is Is the sample mean of sample 1 greater than the sample mean of sample 2? This test evaluate if their difference will be significantly greater than zero or not equal to 0. Here we use a one-tailed test by computing the confidence
interval for the test at the level of significance If the test statistics for z falls outside this interval we decide that the means differs, we chose the alternate hypothesis, Ha Otherwise we have no reason to think that they differ, H0 |
 |
By Examples:
Problem 2. The personnel officer of a large corporation claimed
that college graduates applying for jobs with their firm in the current
year tended to have higher grade point averages than those applying in
the previous year. Samples from the group of applicants gave the following
results:
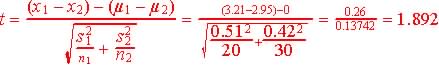
| Sample mean | Sample standard deviation | Sample size | |
| Current year (x1) | 3.21 | 0.51 | 20 |
| Previous year (x2) | 2.95 | 0.42 | 30 |
Is there sufficient evidence to justify the claim at a 5% level of significance?
Given difference ![]() ,
at least one of the sample size < 30 (small so must use the student's
t distribution or t-statistics),
,
at least one of the sample size < 30 (small so must use the student's
t distribution or t-statistics),
Step 1 - Hypothesis: The claim that ![]() , the null hypothesis.
, the null hypothesis.
The alternate hypothesis is that ![]()
H0 :![]()
Ha :![]()
Step 2. Select level of significance:
This is given as ![]() (5%)
(5%)
Step 3. Test statistics and observed value.
Step 4. Determine the critical region (favors Ha)
For alpha = 0.05 at the upper end of intervals: 0.95, ta
= 1.7291 (from reference
table)
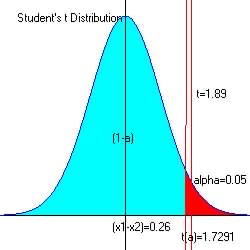 |
The critical region is ![]() with df = 19; smallest of (20-1) and (30-1)
reference
table
with df = 19; smallest of (20-1) and (30-1)
reference
table
Step 5. Make decision.
No not reject the null hypothesis if ![]()
Since 1.892 is > 1.7291 and in the critical region (red) we reject the null hypothesis that grades are the same both years.
The observed t = 1.89 and since 1.89 > 1.73 and is in the critical region, we reject H0 in favor of Ha.
Therefore we conclude that college graduates from current year have higher grades than previous year.
Question 3:
: Is ![]() ?
Ha
(Left-tailed test)
?
Ha
(Left-tailed test)
| Is Is the sample mean of sample 1 less than the sample mean of sample 2? If so then their difference will be significantly greater than zero or not equal to 0. Here we use a one-tailed test by computing the confidence
interval for the test at the level of significance If the test statistics for z falls outside this interval we decide that the means differs, we chose the alternate hypothesis, Ha Otherwise we have no reason to think that they differ, H0 |
 |
By Examples:
Problem 3. A biologist suspected that females age 20 - 24 have
a lower mean systolic blood pressure than males in the same age group.
Independent random sample produced the following results for systolic pressure.
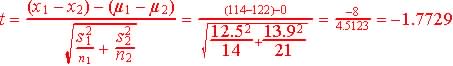
| Sample mean | Sample standard deviation | Sample size | |
| Female (x1) | 114 | 12.5 | 14 |
| Male (x2) | 122 | 13.9 | 21 |
Is there sufficient evidence to justify the claim at a 1% level of significance?
Given difference ![]() ,
at least one of the sample size < 30 (small so must use the student's
t distribution or t-statistics),
,
at least one of the sample size < 30 (small so must use the student's
t distribution or t-statistics),
Step 1 - Hypothesis: The claim that ![]() , the null hypothesis.
, the null hypothesis.
The alternate hypothesis is that ![]()
H0 :![]()
Ha :![]()
Step 2. Select level of significance:
This is given as ![]() (5%)
(5%)
Step 3. Test statistics and observed value.
Step 4. Determine the critical region (favors Ha)
For alpha = 0.05 at the upper end of intervals: 0.95, -ta
=-1.7709 (from reference
table)
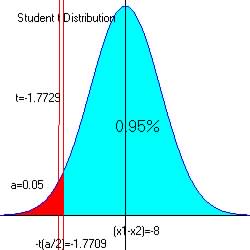 |
The critical region is ![]() with df = 13; smallest of (14-1) and (21-1)
with df = 13; smallest of (14-1) and (21-1)
Step 5. Make decision.
No not reject the null hypothesis if ![]()
Since -1.7729 is < -1.7709 and in the critical region (red) we reject the null hypothesis that female and male systolic pressure are the same..
The observed t = -1.7729 and since -1.7729 < 1.7709 and is in the critical region, we reject H0 in favor of Ha.
Therefore we conclude that female systolic pressure are lower than male's same age (20-24)
If samples being compared are from the same population
where ![]() ,
then the simplified pooled statistics can be used to evaluate the test
of two samples means.
,
then the simplified pooled statistics can be used to evaluate the test
of two samples means.
Some statistician like myself would rather used
the above t-tests when regardless of whether ![]() .
.
| Pooled Test
statistics, t ,
Confidence Interval is |
Pooled Standard
deviation
|
Pooled t procedure Is ![]() ? Ha (one-tailed test)
? Ha (one-tailed test)
| Is Is the sample mean of sample 1 less than the sample mean of sample 2? If so then their difference will be significantly greater than zero or not equal to 0. Here we use a one-tailed test by computing the confidence
interval for the test at the level of significance If the test statistics for z falls outside this interval we decide that the means differs, we chose the alternate hypothesis, Ha Otherwise we have no reason to think that they differ, H0 |
 |
By Examples: Pooled t-procedure
Problem 4. Assume that the populations of both Test A and Test
B below are approximately normal with same or equal standard deviations.
Is the mean of Test A less than the mean of Test B (compare at a 5% level
of significance).
| Sample mean | Sample standard deviation | Sample size | |
| Test A (x1) | 120 | 10 | 6 |
| Test B (x2) | 125 | 9 | 10 |
Given difference ![]() ,
at least one of the same < 30 (small so must use the student's t distribution
or t-statistics), and since assuming that
,
at least one of the same < 30 (small so must use the student's t distribution
or t-statistics), and since assuming that ![]() ,
we will use the pooled t-test.
,
we will use the pooled t-test.
Step 1 - Hypothesis: The claim that![]() , the null hypothesis.
, the null hypothesis.
The alternate hypothesis is that ![]()
H0 :![]()
Ha :![]()
Step 2. Select level of significance:
This is given as ![]() (5%)
(5%)
Step 3. Test statistics and observed value. (since pooled we used the improved pooled statistics:
![]() and
and
![]() when
when ![]()
Step 4. Determine the critical region (favors Ha)
For alpha = 0.05 at the upper end of intervals: 0.95, -ta
=-1.7613 (from reference
table)
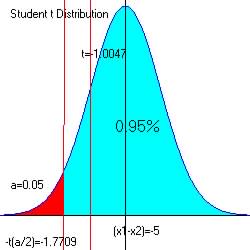 |
The critical region is ![]() with df = 14; n1+n2-2 = 6 + 10 - 2=14
with df = 14; n1+n2-2 = 6 + 10 - 2=14
Step 5. Make decision.
No not reject the null hypothesis if ![]()
Since -1.0047 is > -1.7613 and in not in the critical region (red) we have no reason to reject the null hypothesis that both means are the same.
The observed t = -1.0047 and since -1.0047 > -1.7613 and is not in the critical region, we accept H0.
Therefore we conclude that means are the same for both Tests (or no
significant difference between them).