Test for Population proportions (large sample size).
Statistics involving population proportion often
have sample size that is large (![]() ),
therefore the normal approximation distribution and associated statistics
is used to determine a test for whether the sample proportion = population
proportion.
),
therefore the normal approximation distribution and associated statistics
is used to determine a test for whether the sample proportion = population
proportion.
That is, when the sample size is greater than
or equal to 30 we can use the z-score statistics to compare the sample
proportion against the population proportion using value of the sample
standard deviation, ![]() to estimate the sample standard deviation,
to estimate the sample standard deviation, ![]() if it is not known.
if it is not known.
The sample distribution of P (proportion) is approximately
normal with a mean or expected value, E(P) = ![]() and standard error
and standard error ![]() .
.
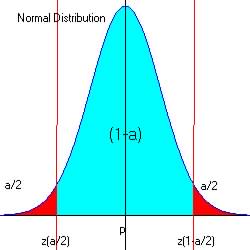
There are three questions one may ask when comparing two proportions:
Question 1::
Is ![]() ? Ha (Two-tailed test)
? Ha (Two-tailed test)
Question 2:
: Is ![]() ? Ha (Right-tailed test)
? Ha (Right-tailed test)
Question 3:
: Is ![]() ? Ha (Left-tailed test)
? Ha (Left-tailed test)
1. Know the statistics used to test ![]() for large sample size.
for large sample size.
The test statistics is related to the standard normal distribution:
| The z-score
statistics for proportions
Proportion mean is:
Standard deviation:
The confidence interval,
|
 ,
where p = proportion estimate, q=1-p and
,
where p = proportion estimate, q=1-p and Upper-Tailed Test (![]() ):
):
Accept H0 if ![]()
Reject H0 if ![]()
Lower-Tailed Test (![]() ):
):
Accept H0 if ![]()
Reject H0 if ![]()
Two-Tailed Test (![]() ):
):
Accept H0 if ![]()
Reject H0 if ![]()
2. Know how to use appropriate statistics to test if a sample proportion is equal to the population proportion (large sample size).
3 Types of tests in comparing sample mean to population mean:
When comparing the sample mean, ![]() to the population mean (
to the population mean (![]() is known) there are 3 question to considered:
is known) there are 3 question to considered:
Question 1: : Is ![]() ? Ha (Two-tailed test)
? Ha (Two-tailed test)
Question 2: : Is ![]() ? Ha (Right-tailed test)
? Ha (Right-tailed test)
Question 3: : Is ![]() ? Ha (Left-tailed test)
? Ha (Left-tailed test)
Question 1:
: Is ![]() ? Ha (Two-tailed test)
? Ha (Two-tailed test)
| Is Is the new mean different from the population proportion? Here we use a two-tailed test by computing the confidence
interval for the test at the level of significance If the test statistics for z falls outside this interval we decide that the means differs, we chose the alternate hypothesis, Ha Otherwise we have no reason to think that they differ, H0 |
 |
By Examples:
Problem 1. A sample of 1000 customers this year resulted in 791 responding favorably to a certain proposal, if the original last year's customer's favorable response to the same proposal was 90% of those responding or p = 0.90, is there a change in customer response?
This problem could be stated with either sample p exactly equal population p or sample p < population p, we will use the former.
Given ![]() ,
n = 1000 (large so can use normal approximation of z-score),
,
n = 1000 (large so can use normal approximation of z-score), ![]() ,
and
,
and ![]()
Step 1 - Hypothesis: The claim that ![]() or 0.878 = 0.90, the null hypothesis.
or 0.878 = 0.90, the null hypothesis.
The alternate hypothesis is that ![]()
H0 :![]()
Ha![]() or
or ![]()
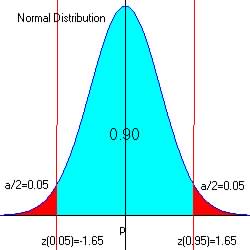
Step 2. Select level of significance:
This is given as ![]() (1 - 0.10)
(1 - 0.10)
So for two-tailed test: ![]()
Step 3. Test statistics and observed value.
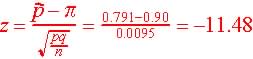 ,
,
Step 4. Determine the critical region (favors Ha)
For alpha = 0.05 at both ends of intervals: 0.05 and 0.95, z
= -1.65 and z = 1.65
 |
Step 5. Make decision.
Accept the null hypothesis if ![]() or
or ![]()
The observed z = -11.48, and since -11.48 < -1.65 and in the critical region, we reject H0 in favor of Ha.
So the this year's proportion of 0.791 differs from the last year's proportion of 0.90.
Question 2:
: Is ![]() ? Ha (Right-tailed test)
? Ha (Right-tailed test)
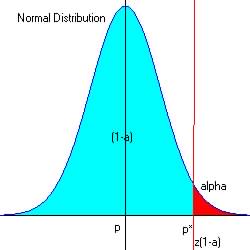
| Is Is the new mean greater than the population proportion. Here
we use a right-tailed test by computing the positive z-score for
the test at the level of And if the test statistics for z falls within the critical region (red) we decide in favor of the alternate hypothesis, H0 Otherwise we have no reason to think that they differ, Ha |
 |
By Examples:
Problem 2. A graduate school is testing the null hypothesis that greater than ½ (p = 0.50) of all MBA's continue their formal education by taking courses within 10 years of graduation. Using a sample of 200 persons, 111 had taken course work since receiving their MBA. At the alpha = 0.05 significance level. Should the graduate school accept of reject the null hypothesis?
Given ![]() ,
n = 200 (large so can use normal approximation of z-score),
,
n = 200 (large so can use normal approximation of z-score), ![]() ,
and
,
and ![]()
Step 1 - Hypothesis: The claim that![]() or 0.555 = 0.50, the null hypothesis.
or 0.555 = 0.50, the null hypothesis.
The alternate hypothesis is that ![]()
H0 :![]()
Ha![]() or
or ![]()
Step 2. Select level of significance:
This is given as ![]() (5%)
(5%)
Step 3. Test statistics and observed value.
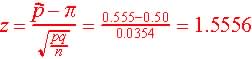 ,
,
Step 4. Determine the critical region (favors Ha)
For alpha = 0.05 at the upper end of the acceptable region, z0.95 = 1.65
From reference
table (search for z with Pr[z=? ] = 0.95.
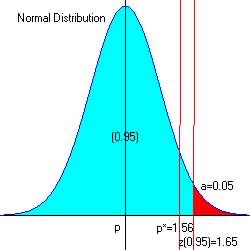 |
Step 5. Make decision.
Accept the null hypothesis is ![]()
The observed z = 1.56, and since 1.56 < 1.65 then it is not in the critical region, so there is no reason to reject H0 in favor of Ha.
So the about 50% of all MBA's continue their education after graduate after graduation..
Question 3:
: Is ![]() ? Ha (Left-tailed test)
? Ha (Left-tailed test)
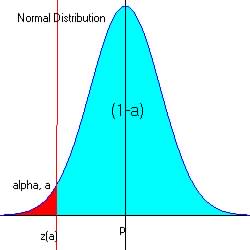
| Is Is the new mean less than from the population proportion. Here
we use a left-tailed test by computing the negative z-score for
the test at the level of And if the test statistics for z falls within the critical region (red) we decide in favor of the alternate hypothesis, H0 Otherwise we have no reason to think that they differ, Ha |
 |
By Examples:
Problem 3. A professional group claims that at least 40% (p=0.40) of all engineers employed by computer companies switch jobs within three years of being hired. The alternate hypothesis is that the rate of job changing is below 40%. At a significance level of 0.01, should the claim be accepted or rejected if the sample size results show that 25 out of n = 1000 engineers changed jobs?
Given ![]() ,
n = 100 (large so can use normal approximation of z-score),
,
n = 100 (large so can use normal approximation of z-score),
![]() ,
and
,
and ![]()
Step 1 - Hypothesis: The claim that ![]() or 0.25 = 0.40, the null hypothesis.
or 0.25 = 0.40, the null hypothesis.
The alternate hypothesis is that ![]()
H0 :![]()
Ha![]() or
or ![]()
Step 2. Select level of significance:
This is given as ![]() (1%)
(1%)
Step 3. Test statistics and observed value.
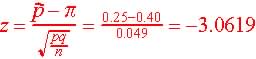 ,
,
,
Step 4. Determine the critical region (favors Ha)
For alpha = 0.01 at the lower end of the acceptable region (Pr[a]=0.01), z = -2.33
From reference
table (search for z with Pr[z=? ] = 0.01.
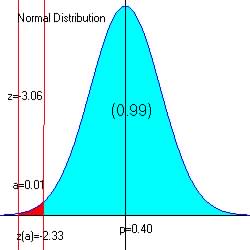 |
Step 5. Make decision.
Accept the null hypothesis is ![]()
The observed z = -3.06, and since -3.06 is in the critical region (red ![]() ),
we reject H0 in favor of Ha.
),
we reject H0 in favor of Ha.
So Less that 40% of engineers working in computer companies change jobs
within 3 years of being hired.