Hypothesis Testing
Hypothesis testing is a procedure that examines two alternative positions in which a test is made to determine which of the positions may be true within certain level of confidence.
The position that states that things are the same is called the null hypothesis; the position that states that things are not the same is called the alternate hypothesis. In accepting the alternate hypothesis one rejects the null hypothesis and in accepting the alternate hypothesis, one rejects the null hypothesis.
1. Know the definitions of the two opposing positions for an hypothesis test.
There are two positions or views for an hypothesis test:
| (1) The null hypothesis is a statement asserting no change or difference about a population parameter; it is denoted by the symbol H0. |
| (2) The alternate
hypothesis is a statement that rejects the null hypothesis or a statement
that might be true if the null hypothesis is not; it is denoted by the
symbol Ha.
The alternate hypothesis may contain the symbol, >, <, |
Example: If one wishes to test that the sample mean = the population mean given normal errors of experiments. Then one would, for example, compare the value of the sample mean with that of the population mean and if the difference is small, then one would accept that both are the same or that
The null hypothesis is not rejected (almost saying that its is
true) or ![]() .
.
Know how much the difference in comparing both means will be in order to reject the null hypothesis (that both means are not the same) is a matter of probability or how confident or certain you want to be in making that judgment.
In hypothesis testing we present this view of deciding on a level of
acceptance of the null hypothesis: If there is a low probability that we
can reject the null hypothesis, then we say that the null hypothesis "is
true."
| Note statisticians never say that we accept the null hypothesis, but rather that there is no significant reason to reject it. |
This low probability of rejecting the null hypothesis is called the
significant
level, and is called alpha or denoted by the symbol,
a
or ![]() .
.
2. Know the meaning of the test statistics used in hypothesis testing.
Acceptance Criterion.
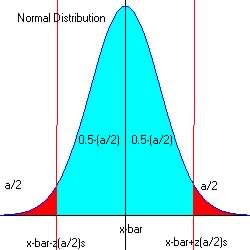
The goal of statistical hypothesis testing for this chapter and many
others using a distribution for the test, say a normal distribution is
to accept the null hypothesis if the statistical estimator falls within
the acceptable blue region of the confidence
interval based on the level of significance or probability of acceptance
and to reject if its falls in the red region.
See Figure 7b.1 below:
 |
| The test statistics is the value or quantity that is used to make a decision in testing the hypothesis. |
If the blue region is the acceptable region then the red region is the rejectable regions.
For every possible types of statistical tests there are preferred test statistics used to make judgment about the null hypothesis, in the next several chapters we will study many of these.
Example: If the acceptable region for a test is the blue
region and its confidence interval is ![]() ,
then a value z = 2.0 falls outside this region so the null hypothesis is
rejected; however a value of z = 1.14 falls within this region so there
is no reason to reject the null hypothesis.
,
then a value z = 2.0 falls outside this region so the null hypothesis is
rejected; however a value of z = 1.14 falls within this region so there
is no reason to reject the null hypothesis.
Throughout this text we will use the phase "there is no reason to reject the null hypothesis" when "accepting" the null hypothesis .
The critical region is the region outside the confidence interval for z that favors the alternate hypothesis - The red region.
The values of z at the endpoints of the critical region is called
the critical values. In the last example, the critical values
are ![]() .
.
3. Know the meaning of the critical
region and level of significance of the hypothesis test.
| The critical region is the values of the test statistics that provides evidence in favor of the alternate hypothesis. Therefore, a value in the critical region results in a decision to reject the null hypothesis. |
| Alpha or |
4. Know the two types of errors associated with hypothesis testing.
Type I error (producer's risk)
Even though it is unlikely that the test statistics will fall into the critical region (red) when the null hypothesis is true, it is still possible.
When this occurs, we reject H0, when indeed it is true, and
therefore make an error in doing so.
| A Type I error is an error in rejecting the null hypothesis when it is true, and this happens if the test statistics falls inside the critical region (red). |
The probability of rejecting the H0 when it is true is called ![]() ,
where
,
where
Type II error (consumers's risk)
Another type or error is to not reject the null hypothesis when it is false. This is called a type II error. It is the probability that not rejecting the null hypothesis when it is indeed false.
This happens when the test statistics does not fall in the critical
region when H0, is false.
| A Type II error is an error in accepting the null hypothesis when it is false, and this happens if the test statistics falls inside the acceptable region (blue) when it should be fallen in the red region or critical region. |
The probability of accepting the H0 when it is false is called ![]() ,
where
,
where
5. Know the basic steps taken to perform a hypothesis test.
These are the steps required to perform a hypothesis test.
Worksheet - Hypothesis Testing
Choose Test Name: (e.g. Chi-square Goodness-of-fit):__________________________________________
| Enter sample and population parameters:
Others:
Sample size, n = _____
|
|||
| (1) Select Null Hypothesis: H0 | Alternate Hypothesis: Ha | ||
| (2)
Choose level of Significance, Write |
Enter degrees of freedom, d.f. | ||
| (3)
Write and Compute the Test Statistics (e.g. z-score and
t):
|
|||
| (4) Select Critical Region of Test Criterion: | |||
| Lower-Tailed Test
|
Two-Tailed Test
|
Upper-Tailed Test
|
|
| (5) Make Decision: | |||


