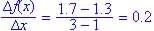
Concave down:
Since rate of change is decreasing
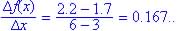
Concave down:
Since rate of change is decreasing
Concave down since from graph the slope is becoming less positive as x increases.
Concave up since from graph the rate of change is increasing and function is increasing.
The function is increasing since new people are always trying the product.
Concave up at first but after many people start using the product the rate slows down and graph becomes concave down.
(a) Increasing rapidly at first, then slowly at the end: true for Table (E) and Graph (III)
(b) Growing at a constant rate:
true for Graph (I)
(c) Rate is increasing faster and faster as x gets larger: true for Graph II.
(a) The volume of water increases throughout the interval A to F.
(b) The volume of water is constant when the rate is zero; i.e. Interval O to A.
(c) The volume of water is increasing most rapidly from D to E.
(d) Volume of water decreases when rate is negative, that is, interval F to I.
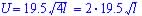
| (a) If l
is length of salmon and speed is u, then
Larger salmon's length = 4l and speed is U, then
So larger swims twice as fast as smaller. |
Typical graph
Increasing and concave down |


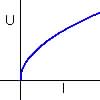
(c) The larger swains faster than the smaller.
(d) Since graph is concave down changes in l gives smaller changes in U for larger l. So the difference in speed between smaller fishes is greater than the difference in speed between tow larger fishes.