| (a) | (b) | ||
|
Interval |
|
|
 |
| (i)t=2 and
t = 5 |
5 - 2 = 3 | 150 - 60 = 90 |  |
| (ii) t=0.5
and
t=2.5 |
2.5 - 0.5 =2 | 75 - 15 = 60 |  |
| (iii) t=1.5 and t=3 | 3 - 1.5 = 1.5 | 90 - 45 = 45 |  |


The average speed is 30 mph (for entire trip)

(a) Rate between (-2, -7) and (3, 3) is
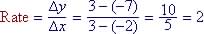
(b) The function is increasing over the interval since the average rate of change is positive
(c) The function is increasing everywhere.
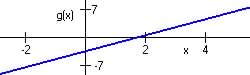
(a) Estimated rate is 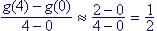
(b) Line segment for (a) have points: (0, 0) and (4, 2)
(c) Estimated rate is 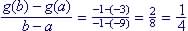
since g(-9) is about -3 and g(-1) is about -1
(d) Line segment for (a) have points: (-1,-1) and (-9, -3)
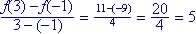
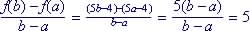
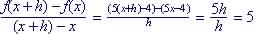
f(x) = 5x - 4
(i) Between (-1, f(-1)) and (3, f(3)):
(ii) Between (a, f(a)) and (b, f(b)):
(iii) Between (x, f(x)) and (x+h, f(x+h)):
(a) s is a function of t (pass vertical line test)
(b) Function increasing on intervals:

(a) Table 1.2.16 Carl Lewis' Times at 10 m intervals
| Time
(sec) |
Distance
(meters) |
Rate
(meters / sec) |
| 0 - 1.94 | 0 - 10 | 1.94/10 = 5.15 |
| 1.94 - 2.96 | 10 - 20 | 9.8 |
| 2.96 - 3.91 | 20 - 30 | 10.53 |
| 3.91 - 4.78 | 30 - 40 | 11.49 |
| 4.78 - 5.64 | 40 - 50 | 11.63 |
| 5.64 - 6.50 | 50 - 60 | 11.63 |
| 6.50 - 7.36 | 60 - 70 | 11.63 |
| 7.36 - 8.22 | 70 - 80 | 11.63 |
| 8.22 - 9.07 | 80 - 90 | 11.76 |
| 9.07 - 9.93 | 90 - 100 | 11.63 |
(b) He attained his maximum speed of 11.76 meters/sec between 80 and 90 meters. He does not run his faster when he crossed the finish line since speed 11.63 is less than his faster speed.