Given: P0 = 651, 000 and declines at a rate of 1.2% per year.
Exponential decreasing function: Pt = P0(1 - r)t
(a) Formula is Pt = 651(0.988)t (in thousands)
(b) Pop in 2010: t = 10 is
P10 = 651000(0.988)10 = 576,966
(c) When is pop = 550,000? t = 13.96 years
Since 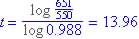
Exponential decreasing function: y = y0(1 - r)t
(a) Formula is y = 10000(0.90)t , Since y0 = 10000.
(b) 5 years from now, y(5) = 10000(0.9)5 = 5905 cases
(c) Find t when y(t) = 1000.
1000 = 10000(0.90)t ., t = 21.854 years
Since 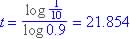
Exponential increasing fct: Pt = P0(1 + r)t
(a) Since 340 = 10(b)5, 
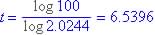
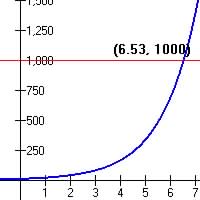
Pt = 10(2.0244)t
(b) Graphically estimate of when P = 1000 is shown in Figure 10.1
From graph, t = 6.5296 years
Since