(a) Graphs (I), (III), (IV), (V), (VII) and (VIII) are functions since pass vertical line test
(b) i. Graphs (V) and (VI) would represent SAT Math score versus SAT Verbal score for a number of students and ii. Graph (VIII) would represent Number of daylight per day as a function of the day of the year.
(c) Graph (III) could represent a constant train fare throughout the day while Graph (IV) could represent rush hour and off rush hour train fare as a function of time of day
(a) The graph of a function can only cross the y-axis once, otherwise it would fail the vertical line test
(b) The graph of a function can cross the x-axis an infinite number of times, e.g.
y = sin(x)
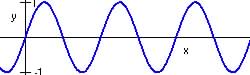
Table 1.6 Rank, r with respect to time, t in years
| t | 0 | 1 | 2 | 3 | 4 | 5 | 6 | 7 | 8 | 9 | 10 | 11 |
| r | 20 | 16 | 15 | 11 | 7 | 5 | 3 | 2 | 2 | 1 | 1 | 1 |
(a) f(3) = 11, Jacob ranked 11th in year 3
(b) f(t) = 3, when t = 6, Jacob was the 3rd most popular name in year 6.
(c) f(5) - f(4) = 5 - 7 = -2, The name Jacob rose by 2 from year 4 to 5 (lower r gives higher rank)
(d) f(11) - f(10) = 1 - 1 = 0, The popularity of the name Jacob did not change between year 10 and 11.
(a) Table 1.26 Relationship between cost, C and number of liters, l.
| liters in million, l | 0 | 1 | 2 | 3 | 4 | 5 |
| C (million, $) | 2 | 2.5 | 3 | 3.5 | 4 | 4.5 |
(b) Cost, C = Fixed Cost + Variable cost
C = 2 + (0.5)l. (in millions $)
Note that if d = distance,
s = speed or rate and t = time, then 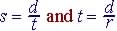 (note r = s)
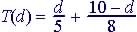
Total Distance = distance walked + distance jogged or 10 = d + (10- d)
Since given speed walked = 5 mph and speed jogged = 8 mph, then
Total trip time = Time walked + Time jogged or