|
General Statistics
|
Examples
Inference about means and proportions.
|
Programs
/ Reference Tables Hypothesis
Worksheet
Chapter 7 - Statistical Inference: Population mean and proportion
Question 1 If last years mean income of a small town was $25,300
and this year a survey of 40 random household in that town showed a mean
income of $29,400 and a standard deviation of $6,325.
(a) Find a 95% confidence interval for the mean income for the town.
(b) Based on answer in part (a) could you conclude that the mean income
increased from last year to this year?
Choose Test Name: (Test for population
mean, Large sample Size)
Enter sample and population parameters:  =
6325/6.325 = 1000 =
6325/6.325 = 1000
Sample size, n = 40 (Large)  = $6,325
  = $29,400 and
  = 25,300 (the population mean given above)
 |
| (1)
Select Null Hypothesis: H0
= |
Alternate Hypothesis: Ha
> |
(2)
Choose level of Significance,  = 5% or 0.05
Write  = 0.95
 |
Enter degrees of freedom,
d.f.
n = 40 |
(3)
Write and Compute the Test Statistics ( z-score):  = (29400 - 25,300) / (6,325 / 6.3246) = 4.1
 |
(4)
Select Critical Region of Test Criterion: z-score for
z0.025 = -1.95 and z0.975 = 1.96
The 95% confidence interval is
+ (z0.025)
to
+ (z0.975 )=
29,400 - 1.96(1000) to 29,400 + 1.96(1000)
(a) So 95% confidence interval
is $27,439.86 to
$31,360.14
(The critical region is outside this interval) |
(5)
Make Decision: Since 4.1 is > than 1.96 and 25,300 is not within the confidence
interval we reject the H0
that
=
(b) Therefore
this year's mean of $29,400 is significantly larger than $25,300 |
Question 2 The noise level tested at an average decibel of 65
with a standard deviation of 6 from a sample of 40 cars driving on the
Columbus Bridge.
(a) Find a 90% confidence interval for the mean decibel levels of vehicles
driving on the bridge.
(b) Is the noise level significantly lower that 80 decibels?
(c) What is the maximum error of the estimate at the 90% level?
Choose Test Name: (Test for population
mean, Large sample Size)
(c) The maximum error of the estimate,
E = z() = 1.65(0.9487)
= 1.57 decibles
Question 3 A study of the dietary calories from fat intakes of
33 males living on a small Caribbean island gave a sample mean of 23.9%
and a sample standard deviation of 4.6% calories from fats.
(a) Find a 95% confidence interval for the mean of the population from
the men selected.
(b) Is the percent calories from fat equal to 25%?
(c) What is the maximum error of the estimate for the population mean?
Choose Test Name: (Test for population
mean, Large sample Size)
(c) The maximum error of the estimate,
E = z() = 1.96(0.7889)
= 1.55%
Question 4 How many household in a small town must be randomly
selected to estimate the dollar amount spend on animal products per week
within $3 of its true value with a 90% confidence if the standard deviation
from past studies was $25?
 :
z (90%) or alpha = 0.10 and alpha / 2 = 0.05 so z0.05
= 1.65, s = 25 and E = 3, so n = z(s)/E = (1.65)(25)/3 = 13.75
:
z (90%) or alpha = 0.10 and alpha / 2 = 0.05 so z0.05
= 1.65, s = 25 and E = 3, so n = z(s)/E = (1.65)(25)/3 = 13.75
Question 5 A speculator believes that the average depth of finding
water for well installation on newly developed lands in Duchess County
is less that 500 feet. If a sample of 32 wells throughout the country gave
a mean depth of 486 feet and a standard deviation of 53 feet. At the 1%
confidence level is the speculator's assumption correct?
Choose Test Name: (Test for population
mean, Large sample Size)
Question 6 A doctor recorded the recovery times in days
for 38 patients from a new procedure and hope that the recovery time would
be less that other procedures of 6.5 days. If the mean recovery time for
patients from the sample is 5.84 days and the standard deviation is 2.41
days. Does this data support the doctors hypothesis?
(a) Use the classical methods of confidence interval to draw your conclusion
(b) use the P-value approach
Choose Test Name: (Test for population
mean, Large sample Size)
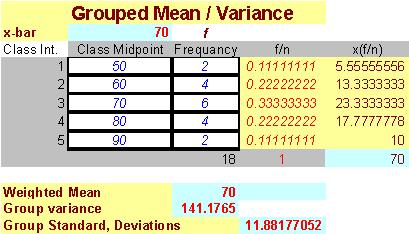
Question 7 On a mathematics final exam the following sample distribution
was obtained.
Is the average results from the final exam the same as last years average
of 75% at the 5 % level of significance?
| Grade |
50 |
60 |
70 |
80 |
90 |
| Number of Students |
2 |
4 |
6 |
4 |
2 |
First Find the mean and standard deviation from the sample distribution
Choose Test Name: (Test for population
mean, small sample Size)
Question 8. A researcher suspected that smokers between the age
of 40 and 45 who had developed chronic bronchitis
had smoked for more than 20 years. A sample of 10 such patients gave
the number of years that the smoked which is given in the table below.
At the 1% significance level is there enough evidence to justify the
researcher's suspicion?
| 22 21 19 25 24 26 23 23 21 22 |
First compute the mean and standard deviation:
Mean = 22.6 and standard deviation
= 2.0656
Choose Test Name: (Test for population
mean, small sample Size)
Question 9 A study of 298 men treated for prostate cancer at
an early stage had 271 recovered within 5 years.
(a) Find a 95% confidence interval for the proportion of men who recovered
within 5 years so treated.
(b) Could you say that 95% of the men recovered at the 95% significance
level?
Choose Test Name: (Test for population
proportion, Large sample Size)
Question 10 In a poll of customers who buy a service 383 of 935
said that they were not satisfied with service the were it was.
Find a 95% confidence interval of the number of customers unsatisfied
with service.
Choose Test Name: (Test for population
proportion, Large sample Size)
 = (70 - 75) / 2.8006 = -1.7853
  = (0.9094 - 0.95) / 0.01662 = -2.454