
(b) Sum of frequencies up to and including 9 is 33 so percentage less than 10 is
![]()
|
|
Descriptive Statistics - Introduction |
| 8 | 7 | 6 | 9 | 4 | 5 | 3 | 7 | 8 |
| 10 | 7 | 7 | 6 | 4 | 10 | 3 | 6 | 8 |
| 2 | 5 | 4 | 5 | 3 | 8 | 7 | 4 | 6 |
| 3 | 7 | 12 | 4 | 3 | 6 | 6 | 9 | 4 |
(a) Construct the frequency distribution.
(b) What percentage of recovery times were less than 10 days?
Solutions:
(a) The frequency distribution (the number of times each occurred) of
each recovery times (range from 2 to 12) is:
| Recovery Times, x | 2 | 3 | 4 | 5 | 6 | 7 | 8 | 9 | 10 | 12 | Total |
| Frequency, f | 1 | 5 | 6 | 3 | 6 | 6 | 4 | 2 | 2 | 1 | 36 |
|
(b) Sum of frequencies up to and including 9 is 33 so percentage less than 10 is
|
Question 2. The owner of a small business wants to analyze the
profits (thousands of dollars) over the past 30 years.
The ordered data from smallest to largest profits are as follows:
| 15 | 17 | 18 | 19 | 20 | 20 | 20 | 21 | 23 | 23 | 24 | 24 | 24 | 24 | 24 |
| 25 | 25 | 25 | 25 | 25 | 26 | 26 | 27 | 27 | 28 | 29 | 30 | 30 | 31 | 32 |
(a) Complete the grouped frequency distribution table:
| Class | Class boundaries | Frequency |
| 2 | 17.5-20.5 | |
(b) What is the class width?
(c) Compute the relative frequency of each class
(d) What is the median and mode?
Solutions:
(a), (b) and (c) Relative Frequency table - Class width is 20.5 - 17.5
= 3
| Class | Class boundaries | Frequency
(1) |
Relative Frequency
(1) / (2) |
| 1 | 14.5-17.5 | 2 | 0.667 |
| 2 | 17.5-20.5 | 5 | 0.167 |
| 3 | 20.5-23.5 | 3 | 0.1 |
| 4 | 23.5-26.5 | 12 | 0.4 |
| 5 | 26.5-29.5 | 4 | 0.133 |
| 6 | 29.5-32.5 | 4 | 0.133 |
|
|
(2) Sum = 30 | Sum =1 |
(d) The mode is 24 and 25 since they appears the most, 5 times
The median is (24 + 25) /2 = 24.5
Question 3 - The following is the world distribution of nuclear
reactors in operation:
| United States | 109 | Russia | 29 |
| France | 56 | Canada | 21 |
| Japan | 51 | Germany | 20 |
| United Kingdom | 35 | Others | 116 |
| (a) Construct a bar graph
|
(c) Construct a pie chart
|
Question 4. From the following data (per 1000 population) for
selected countries:
Compute the statistics required for a box-plot diagram: Ordered Data
| 4.9 | 5.1 | 6.3 | 6.7 | 7 | 7.1 | 7.8 | 8.6 | 8.7 | 8.8 | |
| 8.9 | 9 | 9.4 | 9.4 | 9.5 | 9.6 | 9.9 | 10 | 10.1 | 10.1 | |
| 10.1 | 10.3 | 10.4 | 10.7 | 10.9 | 11.3 | 11.6 | 11.8 | 14.3 |
Solutions: (see programs)
| min | 25 percentile | median | 75 percentile | max |
| 4.9 | 8.6 | 9.5 | 10.3 | 14.3 |
|
||||||||||||||||||||||||||||||||||||||||||||||||||||||||||||||||||||||||||||||||||||||||||||||||||||||||||||||||||||||||||||||||||||||||||||||||||||||||||||||||
Question 5 The following grouped frequency distribution represents the ages (in years) of 59 patients of a counseling center.
(a) Compute a frequency polygon and
(b) Compute the mean and standard deviation of the age of the patients.
| Class Limits | 21-27 | 28-34 | 35-41 | 42-48 | 49-55 | 56-62 | 63-69 |
| Frequency | 3 | 7 | 12 | 15 | 12 | 7 | 3 |
Solution.
| Class Limits | 21-27 | 28-34 | 35-41 | 42-48 | 49-55 | 56-62 | 63-69 |
| Class Midpoint | 24 | 31 | 38 | 45 | 52 | 59 | 66 |
| Frequency | 3 | 7 | 12 | 15 | 12 | 7 | 3 |
| (a) Frequency polygon
|
(b) Weighted Mean and Grouped Standard
Deviations
Weighted Mean = 45 Group variance = 113.2069 Group Standard Deviation = 10.64 |
| Program Output
|
Question 6. The following data gives the average temperatures
per month over a
12-month period for two cities A and B.
| City A | 8 | 14 | 25 | 43 | 54 | 64 | 71 | 69 | 58 | 47 | 29 | 16 |
| City B | 56 | 60 | 58 | 62 | 63 | 68 | 69 | 71 | 69 | 67 | 61 | 58 |
(a) Which of the two cities do you suspect is warmer on average? Which has more temperature variability?
(b) Use the following information and compute the mean and standard deviation for each city.
City A ![]() and
and ![]()
City B ![]() and
and ![]()
| (a) City B has the larger mean
of 63.5
And City A has a larger variation in temperature with a larger variance of 504.64 |
(b) From Formula:
City A City B
City A:
City B: mean = 63.5 and s=5.11 Variance = 26.09 |
| Example of calculation for City
B
|
Question 6 The following data give the time in days from remission
to relapse for 51 patients with an acute illness.
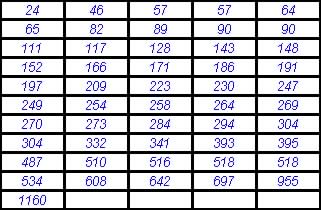 |
Find the following:
| Questions | Solutions from Program |
| (a) The first and third quartiles | 135.5 and 367 |
| (b) The inter quartile range | 231.5 |
| (c) The median | 249 |
| (d) The 95th percentile | 669.5 |
| (e) The percentile rank of 111 | 20% |
 |


