Slopes of Linear Models
The slope of a linear function is a constant value and defines the rate
of change of the dependent variable y with respect to the
corresponding change in the independent variable, x.
Therefore when you write or interpret the slope of a linear model remember
that it's a rate statement: miles per gallon.
As in Figure 2.1
when the slope is positive, we have a increasing function and the linear
models stays trough the form: that is, the slope, m is positive
or
y = b + mx.
In Figure 2.2
when the slope is negative, the sign before the slope in the linear model
becomes negative or y = b - mx.
When there are no change in the dependent variable, y when the independent
variable changes then the slope is equal to 0 as in Figure
2.3.
| Slope
of a line: is the ratio of the rise to the run.
or the rate of change of the function with respect to its independent
variable |
Slopes of Lines:
Lines are representations of linear models and therefore the following
facts about parallel, perpendicular and intersecting lines should be noted:
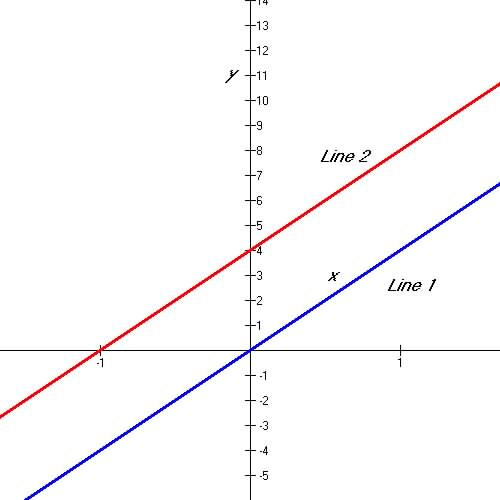
Parallel Lines: Lines are parallel when their slopes are equal to each
other: for line 1 and 2 in Figure 2.5
below the slopes of both lines are equal to 4.
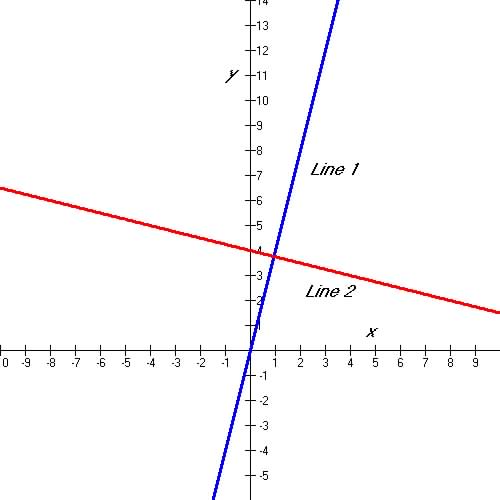
Perpendicular Lines: Lines are perpendicular when their lines are at
right angle to each other and therefore their slopes at are related to
each other by the negative inverse of each other; for line 1 and 2 in Figure
2.6 below the slopes of both line 1 is 4 and the slope of line
2 is -¼ .
Horizontal Lines: Horizontal lines are lines of the form y = c,
where c is a constant. Horizontal lines have slope equal
to 0. (See Figure 2.3).
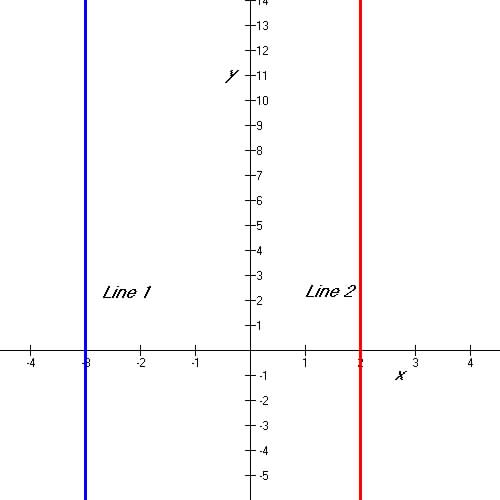
Vertical Lines: Vertical Lines are not functions since they fail the
Vertical Line Test. Vertical lines exist as vertical asymptotes which are
lines where the function have no defined value, and they are of the form
x
= c, where c is a constant. Vertical Asymptotes exist
whenever there is division of the function by zero i.e.  .
Figure
2.7 are two vertical lines at x = -3 and x
= 2. .
Figure
2.7 are two vertical lines at x = -3 and x
= 2.
Table 2.3 Graphs of Parallel, Perpendicular and Vertical Lines
| Figure
2.5 Parallel Lines

|
Figure 2.6 Perpendicular Lines

|
Figure
2.7 Vertical Lines

|
| Positive Slopes: m is (+)
and function is increasing
Negative Slope: m is (-) and function is decreasing
Parallel Lines: Slopes are equal:  (m1 is slope of line 1 and m2 is slope of line 2)
Perpendicular Lines: Slopes are negative inversely related: 
Horizontal Lines: Slopes, m = 0 or y = C, where
C
is a constant
Vertical Lines: Slope is undefined or too large to determine:
x
= C, where C is a constant |
|