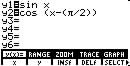
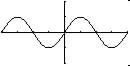
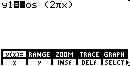
g(x) = cos (
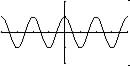
f(x) = sin x
g(x) = cos (![]() )
)
Plot f and g: Viewing Domain: [-2![]() Range [-2, 2]
Range [-2, 2]
Period: 2![]() Amplitude: 1
Amplitude: 1
Conjecture: f(x) = g(x)
same graphs
 |
 |
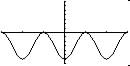
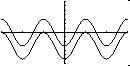
2. Sketch by hand and use a graphing utility to verify: y = cos 2![]() x
x
Period: ![]() Amplitude: 1
Amplitude: 1
Viewing Domain: [-2, 2] Range: [-2, 2]
Key points: max (1,0), y=0(0, ¼ ),
min(-1, ½ ), y=0(0, ¾ ), max(1,1)
 |
 |
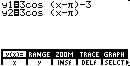
3. Sketch by hand and use graphing utility to verify: y = 3 cos
(x + ![]() )
- 3
)
- 3
Period: 2 ,
Amplitude: 3
,
Amplitude: 3
Shifts: lower bound solve x +  = 0, x = -
Upper bound solve x +  = 2
= 2 , x =3
Viewing Domain [-3 , 3
, 3 ] Range:
[-7, 7]
] Range:
[-7, 7]
 |
 |
y = 3 cos (x +
|
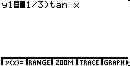
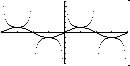
4. Sketch graph ![]() , show at least 2 periods and asymptotes
, show at least 2 periods and asymptotes
Period: ![]() two consecutive asymptotes:
two consecutive asymptotes: ![]()
Viewing Domain [-![]() ,
, ![]() ]
Range: [-5, 5]
]
Range: [-5, 5]
Select [DrawDot] from [FORMAT]
Menu
 |
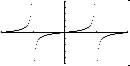 |
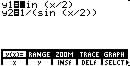
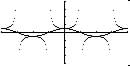
5. Sketch ![]()
Graph ![]() first
first
Period: ![]() =
4
=
4![]() ,
so one cycle 0 to 4
,
so one cycle 0 to 4![]()
Viewing Domain [-![]() ,
, ![]() ]
Range: [-6, 6]
]
Range: [-6, 6]
Select [DrawDot] from [FORMAT]
Menu
 |
Plot both in same viewing window |
|
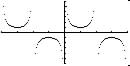
6. Sketch ![]()
Graph ![]() first
first
Period: ![]() so one cycle 0 to
so one cycle 0 to ![]()
Viewing Domain [-![]() ,
, ![]() ]
Range: [-4, 4]
]
Range: [-4, 4]
Select [DrawDot] from [FORMAT]
Menu
 |
Plot: Both y1 and y2 |
|