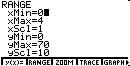
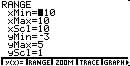
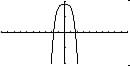
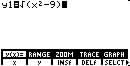
Example 1. Find the Domain and Range of : ![]()
 |
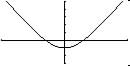 |
Domain:
x
can be all real number
Range:
from graph there is a minimum value for y = -1 at x = 0, so range is y
> = -1
Putting the value of x = 0 in the equation, y = -1, So y = -1 is real for
this function
Since the function is not defined for y < -1, Range
is y > = -1
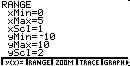
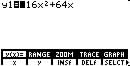
Example 2: the function h(t) represents the height (in feet) of a ball above the ground for time t sec:
h(t) = -16 t2
+ 64 t
|
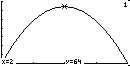 |
Domain:
is
the times in seconds between the ball being thrown and when it hits the
ground i.e. y = 0:
Impose y minimum = 0 for that is the height of the ground
From graph: Domain is 0 =< x =< 4
Range:
is minimum to maximum height, in feet:
From graph this is 0 =< y =< 64 , y
= 64 when x = 2 sec
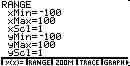
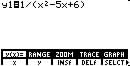
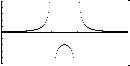
Example 3 Domain and Range Problems: y = 1 / (x2-5x+6)
|
DrawDot Mode |
Domain: From Graph there are two vertical asymptote: at x = 2 and x = 3
So f(x) is defined for: Domain of all values of x except when x = 2 and x = 3
Range: from Graph y is undefined
for x = 2 and x = 3, y = - 4 at x = 2.5, So function is true for y = -
4
However y is never = 0, it gets smaller with increasing or decreasing values
of x but never = 0
And
the Range is; ![]()
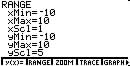
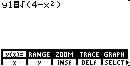
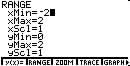
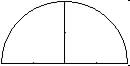
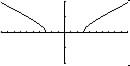
Example 4: Given Domain find Range: y = ![]()
(a) We must have 4-x2 >= 0, that is x2 =< 4, so the
Domain
of f(x) ![]()
(b)Plot y =![]()
 |
 |
(c) Since ![]()
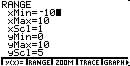
Example 5 Domain and Range
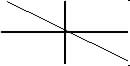
(a) m(x) = 9-x Domain all real numbers, x all real numbers
Range all real numbers, y all real numbers
|
 |
Example 6 y = 9 - x4 Domain all real number, x all
real number
|
 |
Since x4 > positive, largest value of y is when x = 0
So m(x) =< 9 or Range is y =< 9
Example 7 : ![]()
|
 |
|
 |
So domain: ![]() Range y(x) > = 0
Range y(x) > = 0