2. Bars centerd along midpoint of interval
3. Shows frequencies or magnitude of data
4. Categories or data group plotted on x-axis
(horizontal axis)
5. Plots continuous data (interval)
6. Usually no spaces between bars
|
|
Graphs Histogram |
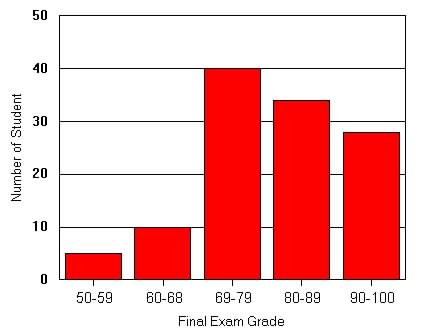
Histogram:
| 1.
Plot data in interval of fixed length
2. Bars centerd along midpoint of interval 3. Shows frequencies or magnitude of data 4. Categories or data group plotted on x-axis (horizontal axis) 5. Plots continuous data (interval) 6. Usually no spaces between bars |
| Histogram
|