|
|
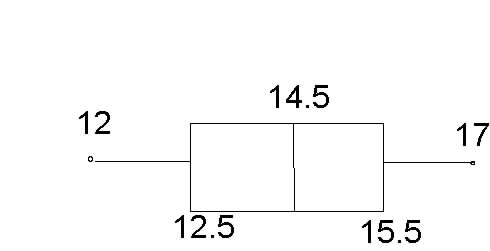
Box and Whisker Plot |
A diagram that shows the following
statistics:
12, 12, 13, 14, 15, 15, 16, 17
1. The Minimum Value
minimum is 12
2. Lower quartile (the median of the 1st one-forth of an ordered list of
numbers)
lower quartile: median of (12, 12, 13, 14) = (12+13)/2 = 12.5
3. The Median
median is average of 14 and 15 = 14.5
4. Upper quartile (the median of the last oneforth of an ordered
list of numbers)
upper quartile: median of (15, 15, 16, 17) = (15+16)/2 = 15.5
5. Maximum Value
maximum is 17
Box and Whisker Plot