Chapter
2.4 Graphs of
Equations
College Algebra
by Example Series
|
Chapter
2.4 Graphs of
Equations
|
College Algebra by Example Series |
Key Concepts: Understand the properties of a graph and know how to graph any equation or function.
Skills to Learn:
1. Know how to tell the difference between an equation and a function
2. Know how to find the intercepts of a graph or function
3. Know how to graph any function
4. Know the basic equation of a circle and how to graph it
5. Know how to solve problems graphically
| A Function -
shows the relationship between one or more variables:
Example Note that for a function there are many possible values of y and x. For example: { (-1, 5), (0, 4), (1, 5), (10, 104), ... } |
An equation -
shows a function rule such as  and possible state the domain or limiting
values for that rule. and possible state the domain or limiting
values for that rule.
Example Note only two values of x, -2 and 2 satisfy the equation |
The y-intercept of a function is the value of the function when x = 0
The x-intercept(s) is the value of x when y = 0
Example 1. Find
the
intercepts of  and graph its function. and graph its function.
First solve for y = f(x) to get
The y-intercept (set x = 0 and solve for y)
A graph of the function would show this to be true. The x-intercept (set y = 0 and solve for x)
|
To Graph the function 
Setup a table of values of x and y and plot each points:
A rule of thumb is to select values of x from -10 through 0 to +10 and find corresponsing values of y to get a set of (x, y) points. |
||||||||||||||||||
Graphs of 
|
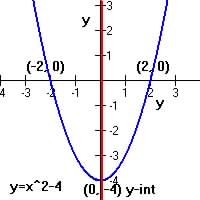
Parabola
- Is a function with x2 as the highest power of
the variable x. So  is a parabola. is a parabola.
Note that the graph is symmetrical about the y-axis (red line), so the line x = 0 is called the axis of symmetry.
The lowest or highest point of a parabola is called the vertex. The vertex of the parabola shown is (0, 4).
This graph is also call a quadratic function. |
Example 2. Find
the
intercepts of  and graph its function. and graph its function.
The y-intercept (set x = 0 and solve for y)
A graph of the function would show this to be true. The x-intercept (set y = 0 and solve for x)
So
|
To Graph the function 
Setup a table of values of x and y and plot each points:
A rule of thumb is to select values of x from -10 through 0 to +10 and find corresponsing values of y to get a set of (x, y) points. |
||||||||||||||||||
Graphs of 
|
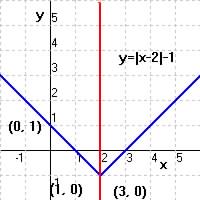
Absolute value - Is a
function with operator
| | where any operation with the | | are assign a positive value. Example |-2| = 2, |3-7| = 4 Note that the graph is symmetrical about the vertical line where the slope of the line change from positive to negative (red line), so the line x = 2 is called the axis of symmetry.
The lowest or highest point of a parabola is called the vertex. The vertex of the parabola shown is (0, 4).
|
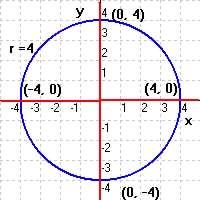
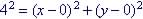
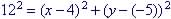
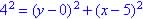
| Find the equation ofa circle
with center (5, 0) and a point on the circle of (1, 0):
A sketch of the circle with center (5, 0) shows that the radius is 4. Equation of a circle is
|
Example 4. Find
the
intercepts of  and graph it. and graph it.
The y-intercept (set x = 0 and solve for y)
A graph of the function would show this to be true. The x-intercept (set y = 0 and solve for x)
Remember that to remove the So
|
To Graph the function 
Setup a table of values of x and y and plot each points:
U means undefined or no solution |
|||||||||||||||||||||||||||
| Graphs of
|
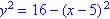
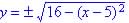
Square root functions various
depending on many factors; see if you could find the intercepts and
graph 
See graphical solution below:
|
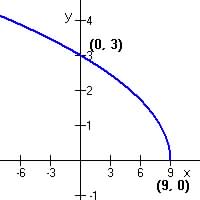
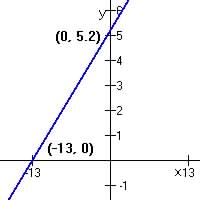
| Example 5.
Find intercepts and graph First solve for y = f(x) to get So graph Intercepts are: (0, 5.2) and (-13, 0)
|
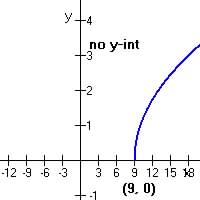
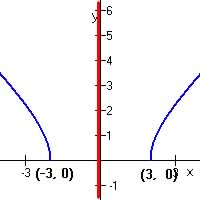
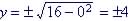
Example 6. Find
intercepts and graph
Intercepts (-2, 0) and (2, 0) - No y-intercept
|
Look at these functions and their graphs
Graphical Solutions to problems
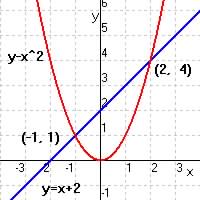
Example 7 Find
the
points of intersection of these two functions 
Note points of intersection from graphs.
|
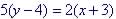
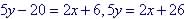
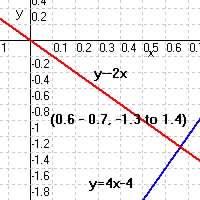
Example 8. Find
the
point (x, y) where these two lines are equal: 
Try and find a solution that is closed to the true soltion.
|
-2x = 4x - 4, -6x = -4, x = 2/3 = 0.67
So y = -2 (0.67) = 1.34
 is function that says, to find the value of
y
first square x and add 4.
is function that says, to find the value of
y
first square x and add 4. is an equation that states only values for
  that are
equal to 0.
that are
equal to 0. .
. or
or

 or
(0, -4)
or
(0, -4)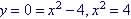 ,
so
,
so 
 or
(-2, 0) and (2, 0)
or
(-2, 0) and (2, 0)
 or
(0, 1)
or
(0, 1) ,
Remember that to remove the | | operator result in use of
,
Remember that to remove the | | operator result in use of  operator.
 or
(1, 0) and (3, 0)
or
(1, 0) and (3, 0)
 and graph it.

 or
(0, -4) and (0, -4)
or
(0, -4) and (0, -4) ,
, operator one must square both
sides.
operator one must square both
sides. or (-4, 0) and (4, 0)


 or
or
 and
and

 or
or same
as orginal equation.
same
as orginal equation.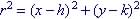

 or
or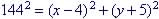
 , where (h, k) is the
x-y coordinates of the center and r is the radius.
, where (h, k) is the
x-y coordinates of the center and r is the radius. 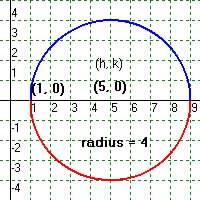
 or
(0, 3)
or
(0, 3)  ,
, operator one must square both
sides.
operator one must square both
sides. or (9, 0)